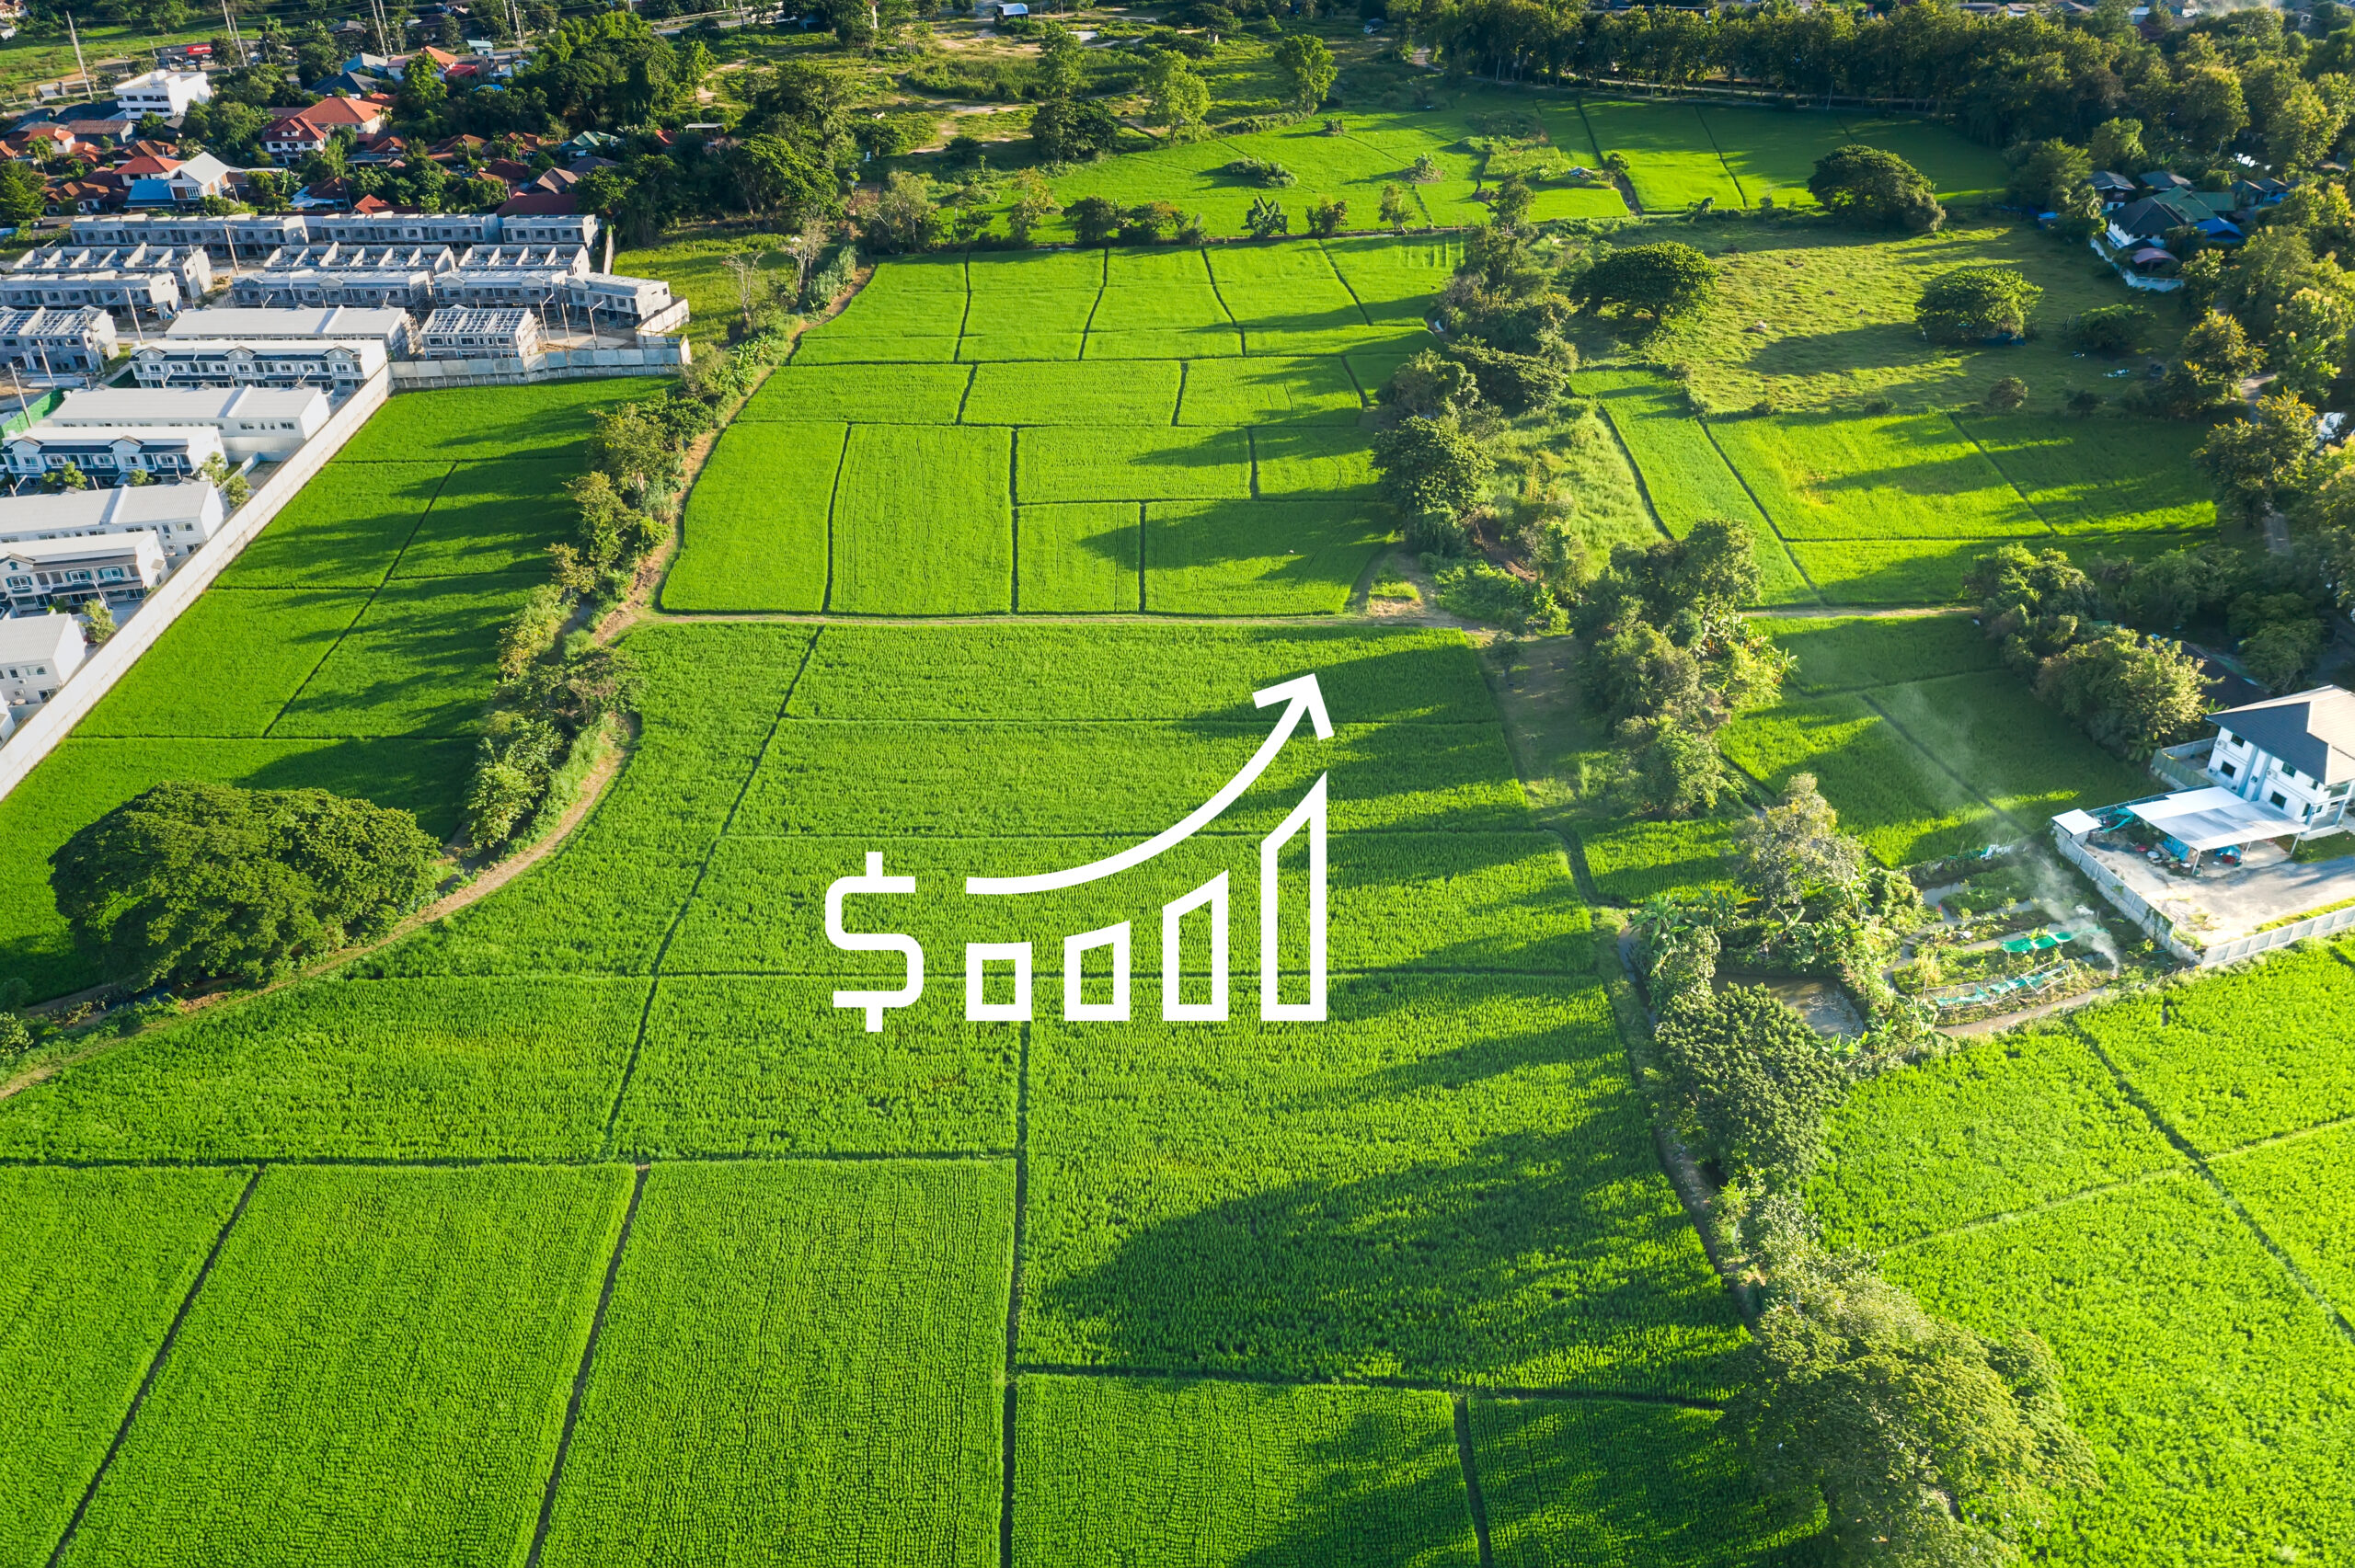
In the last two years, it’s been nearly impossible to avoid the reality that house prices have skyrocketed rapidly. Canadians have watched with awe (and sometimes terror) as rising house prices continued to inflate far beyond what anyone predicted. Even for those who aren’t in the market, either because they are not able to buy or already own their home, the topic has surely come up many times in everyday conversations.
Though prices have gone up nearly everywhere in the country, the extent of the increase has not been the same everywhere. For many different reasons, some markets can see more or less appreciation than others.
While it may be expected that areas like or would see prices go up, there are many others that top the list of highest growth that may surprise you. In this article, we will explore what has caused house prices to rise so much in some areas. We will also look at some of the areas where house prices have risen the most in the last year in each province and what the reasons may be for their growth.
What causes prices to rise?
Home prices have tended to go up over time – this should be obvious to any investor or even regular homeowners. However, the reasons that prices go up can vary and it can be hard to pin down one single cause. If we want to understand not just where prices have risen the most, but why, we need to understand what causes prices to rise.
Real estate, like most other assets, is driven by supply and demand in a relatively open market. While housing supply is relatively slow to develop, housing demand can change very rapidly. Indeed, demand has been one of the main driving factors in prices for the last year. Not only is real estate crucial as it provides a place for people to live, but it’s also a great investment. That, paired with a low-interest rate borrowing environment and the fear of missing out on lower prices, has driven many to the real estate market in recent years. Those who are buying fall generally into two categories with similar but distinct factors that dictate their purchasing decisions. These two groups are those buying for the purpose of having a place to live and those buying for investment purposes.

For those just looking for a place to live, the largest factors that drive demand are quality of life factors. These people are driven to areas that are safe and comfortable to live in. They tend to value things like job options, recreational options, schools for their children, and the cost of living. Generally, these buyers focus more on personal needs and financial ability than on housing market trends and fundamentals.
Investors, on the other hand, care about many of the same factors, especially if they plan on buying a rental, but they also look at market fundamentals, trends, and potential future growth. Smart investors will consider things like average rent and rent growth, employment levels, and rental demand on top of the general factors. Investors also want to see their investment grow, so they will tend to look for areas that may see future interest from residents in the future. Things like the development of new amenities and infrastructure may not be a draw to renters right now, but those same features in five to 10 years can make a big difference.
One thing that both investors and general home buyers look for is price. If given two otherwise identical options, with one being cheaper, most would opt for the lower-priced option. This drives attention towards more affordable areas but can only last for a little while as an area with a lot of attention will quickly increase in price. Buyers also factor interest rates into their buying decisions, however, borrowing costs generally affect all purchases equally and are not really a geographic factor.
How to measure growth?
There are a few ways that we can measure growth when it comes to real estate markets.
Home price growth is most often understood by comparison to previous prices with the year over year growth being the most popular. As a pure dollar value, this will be highest in areas like Toronto where even a 1% price increase is many thousands of dollars more than in most other areas. If you measure year over year change as a percentage, you can more easily compare different markets.
Averages are most accurate in areas where there is a lot of sales data and less so in low sales areas where outliers may skew the average significantly. Another common measure is the MLS Home Price Index which uses data to propose what the price is of an “average” home in the area. This prevents some of the skewing seen in general averages.
To avoid skewed price data, it may also be useful to look at market growth in terms of sales volume. The growth in the number of sales year over year can indicate how popular an area is with buyers which has an effect on price. Sales volume is a hard metric to use right now as 2021 saw unprecedented levels of volume almost across the board.
For the purpose of this article, we will mostly be looking at the average price growth percentage on a year over year basis, and on some occasions, the MLS HPI. Overall, this method offers the best comparison of how values have increased, particularly for investment real estate.
Highest by province
According to the Canadian real estate association (CREA), the average price for a home in Canada is currently at around $796,067, or about 11% higher than one year ago. Let’s look at how each province has grown in the last year.
British Columbia
In British Columbia, the average home price provincially increased by about 15.2% since March 2021. In Greater Vancouver, prices saw an increase of about 18% year over year (though this varies between different sections of the region, with Maple Ridge seeing the highest growth at almost 39%). According to the British Columbia Real Estate Association, the highest growth in average residential price outside of Vancouver was observed in the Powell River area with a 37.8% year over year change.
Alberta
In the last year, Alberta reported more modest growth than other areas, though it’s generally in line with the more affordable markets found in Canada’s middle provinces. According to CREA, the province saw average price growth of 7% since March 2021.
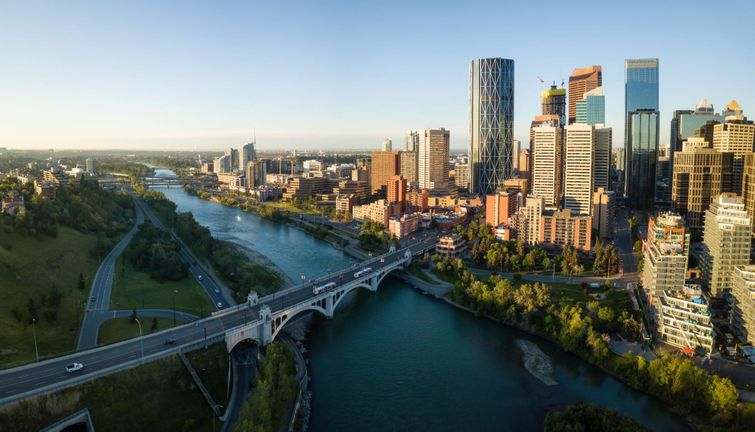
The province’s largest city, Calgary, saw an increase of 16.1% year over year, much . The city also holds the title for the highest growth in the province with the area of North Calgary seeing the highest in the city at 20%. Though it does not have the highest prices in the city, North Calgary saw larger detached home growth than anywhere else and sold the most detached homes by sales percentage. Generally, detached homes have seen the highest growth nationally.
Saskatchewan
In Saskatchewan, the average price of a home went up by just 2.3% in the last year. This makes it the slowest growing market in the country, even in a year of record growth nationally. According to the Saskatchewan Realtors Association, the City of Warman saw the highest increase in its Home Price Index over the last year with a growth of 9.1%. Warman is a small town north of Saskatoon, though it was ranked as one of the fastest-growing municipalities during the 2016 census period. As the population increases, so does the demand for homes and this growth can often happen the fastest as a small town begins to expand. The city could also have benefited from residents relocating from Saskatoon in search of a more small-town lifestyle.
Manitoba
Manitoba saw much higher growth than its prairie neighbours with a 12.5% year over year increase according to CREA. In the province’s largest city, Winnipeg, detached homes increased in price by 14.2% since last year. In Brandon, the average sale price of a detached home went up by 11.5% since last year.
Ontario
Ontario is one of the largest and most active markets in the country and, unsurprisingly, saw some of the highest provincial growth at 18.3% year over year. In the GTA, the average price increase was nearly in line with the provincial average at 18.5%. In Ottawa, growth was a bit slower at around 13% though still a significant change from last year.
However, Ontario saw pretty high increases in many other areas as well. According to OREA, the Western and Northern markets came out on top, with 29% and 30.5% growth respectively. These are areas that tended to have lower prices in the past and likely attracted many investors as prices rose in other areas of the province and many rushed to buy.
Finally, according to Royal LePage data, Kingston saw some of the highest growth nationally in 2021 with an increase of around 38% in average price.
Quebec
In Quebec, home prices grew by an average of 14.7% in the last year, placing it above the national average and just about a half percent below BC’s provincial growth.
In Montreal, the growth was even stronger with a reported 18% growth in detached home prices according to the Quebec Professional Association of Realtors and Brokers.
There were at least three areas of the province reporting a 29% growth in single-family home prices: Joliette, Sainte-Agathe-des-Monts, and Saint-Sauveur agglomérations. However, Joliette seems to take the top spot with a further 38% and 32% growth in condo and plex properties respectively.
New Brunswick
2021 was a big year for the Atlantic provinces and New Brunswick was no exception with a massive 25.4% year over year increase in house prices. That makes it the second-highest provincial average in the country since March 2021. The largest city, Moncton, saw growth on par with the provincial average at exactly 25.4% according to the Greater Moncton Realtors Board.
Other regions in the province also reported similarly impressive growth, but the Northern and Valley Regions of New Brunswick reported the highest price growth at 30.7%.
Overall, New Brunswick and most of its eastern neighbours expanded greatly due in part to relatively more affordable markets attracting where home prices are much more affordable. This trend continues in the next two provinces on our list.
PEI
In the last year, PEI saw average growth in house prices of about 25.7%. That means it saw the highest average growth on the provincial level, according to data from CREA. Unfortunately, due to the small size of the PEI market, there is only one real estate board at the provincial level and statistics for individual towns are harder to come by.
However, growth in PEI paints a clear picture of the changing housing preferences of Canadians during the pandemic years.
Nova Scotia
Nova Scotia experienced much of the same rapid growth as its neighbours with an average year over year price increase of 23.3%. In Halifax, the growth was slightly higher at 24.9% according to the Nova Scotia Association of Realtors. Most other areas in the province saw growth above 20% with the exception of Yarmouth (7.4%) and the Highland region (16.9%). However, the highest growth of all was reported in Annapolis Valley which saw 25.4% growth year over year in March 2022.

Newfoundland and Labrador
Newfoundland stands out among Canada’s eastern provinces as having somewhat lower growth figures. The province saw a 9.5% growth in average home prices. While not as high as its neighbours, this is still a significant increase in price. The capital city, St. Johns, saw similar growth as the provincial average at around 9.2% according to the HPI benchmark price. Like PEI, there is not much more information available on other areas in the province.
Conclusion
2021 was a record year for many aspects of Canada’s housing market. Not only were prices up nearly everywhere in the country but so was sales volume. Meanwhile, stock in many areas continued to crawl downwards as the year progressed. Already, 2022 is presenting itself as quite a different story with house price growth beginning to slow, sales volume coming down from 2021 records, and stock increasing once again. It will be very interesting to see what the next year holds for Canadian housing prices.
Corben joined CREW as a relative newcomer to the field of real estate and has since immersed himself and learned from the experts about everything there is to know on the topic. As a writer with CREW, Corben produces informative guides that answer the questions you need to know and reports on real estate and investment news developments across Canada. Corben lives in Guelph, Ontario with his partner and their two cats. Outside of work, he loves to cook, play music, and work on all kinds of creative projects. You can contact Corben at corben@crewmedia.ca or find him on Linkedin at https://www.linkedin.com/in/corbengrant/.


